Is 2024’s spring market over already? Based on the data, it may have never even begun. After March data came in lower than last year (a record low transaction year) many were hopeful to assume that it was an outlier month, and that April would pick up the majority of activity. However, this has not been the case. In fact, this market continues to break records, with the lowest April sales within our data set, excluding 2020’s lockdown month.
Failure To Launch


RESALE VOLUME
Demand destructrion.
This market continues to break records, and not the kind of records you want to see, with the lowest April sales within our data set, excluding 2020’s lockdown month.
TORONTO METRO SALES

SUPPLY
Supply stable, but increasing.
We saw a big jump up in supply in April, but that is not uncommon. If you examine past years on the chart, you can see April new listings are typically a big jump up from the months prior. This April has been relatively in line with historic April supply, but demand is proving to be the big headwind here, given that nobody can afford to buy homes at these prices and rates.
TORONTO METRO NEW LISTINGS

HOUSE PRICES
Price protection.
Somehow, house prices have been relatively stable and able to continue along their typical seasonal growth trend, where we usually see price metrics grow 5-10% from January until the end of May. This year’s growth has been much weaker than last year, closer to the bottom of that range, while last year’s was much stronger at the top of that range. Demand is likely the driving factor here playing a role in the inability for upward price momentum to sustain past the end of the spring market.
TORONTO METRO REAL ESTATE PRICES

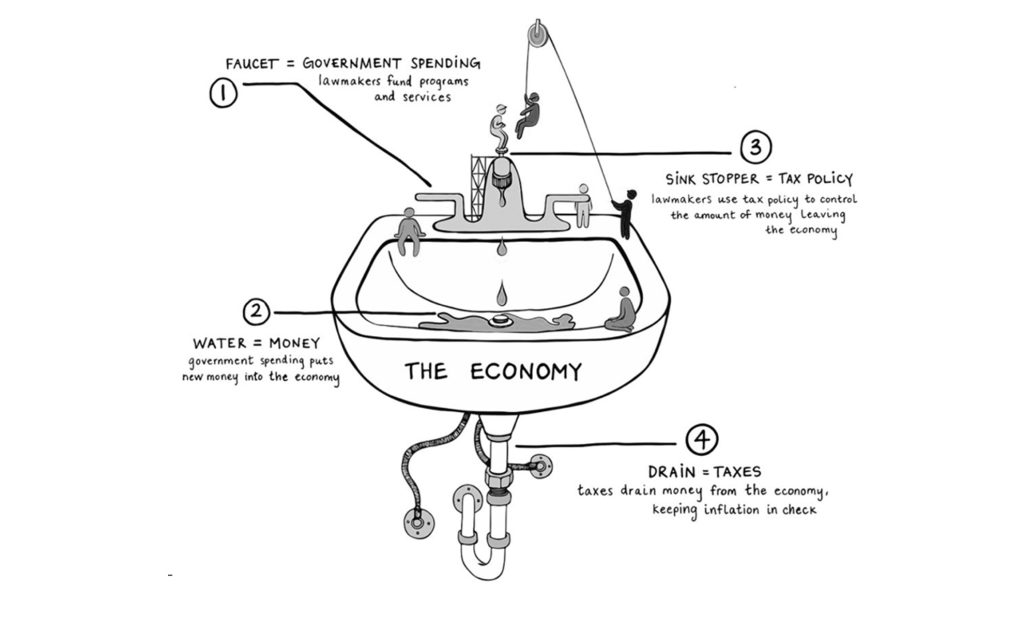
Capital drains.
Marketplace.org did an amazing set of visuals on this that make it easy to understand in the concept of Modern Monetary Theory.
In MMT, taxes serve several key functions beyond controlling inflation:
- Redistributing wealth: Taxes can be used to redistribute resources and reduce inequality, which can support social stability and sustainable economic growth.
- Encouraging or discouraging behaviours: Taxes can incentivize or disincentivize certain economic decisions, like in housing, or fossil fuels, or alcohol and tobacco consumption (all of which are taxed similarly, but that’s another story).
- Sustaining demand for the currency: By requiring taxes to be paid in the government’s currency, MMT argues that this ensures a continued demand for that currency.
Capital gains tax could be used as a way to take money back out of the economy, capturing the value it inflated into the housing asset:
- The faucet is government spending on Canada Mortgage Bonds
- The water is money being used for mortgages
- The sink stopper is an increase to capital gains tax policy
- The drain is the tax revenue earned from increased capital gains tax
If the sink was allowed to spill over, this would be sustained inflation in the housing market.
MODERN MONETARY THEORY
Sales Activity Was Stable
• Toronto Metro sales increased to 7,144 in April.
• They increased by 8% monthly, declined by 6% yearly, and were 24% below the 10-year average.
• On a seasonally adjusted basis, the number of sales declined by 3% compared to the previous month.
TORONTO METRO SALES
New Listings Activity Increased
- The number of new listings increased in April to 16,941.
- They increased by 29% monthly, by 49% yearly, and were 4% above the 10-year average.
- New Listings in Toronto Metro typically increase between December and May.
TORONTO METRO NEW LISTINGS
Active Inventory Increased Significantly
- Active inventory increased to 18,088 in April.
- It increased by 45% monthly, by 74% yearly, and was 26% above the 10-year average.
- Active inventory in Toronto Metro typically grows between December and June.
TORONTO METRO ACTIVE LISTINGS

Resale Market Is Balanced And Getting Weaker
- The market balance indicator, Months of Inventory, weakened in April.
- It was 43% above the 10-year average and historically, based on the current reading, prices have increased at a rate of 3% per year.
- The condo sector remained weaker than the overall market.
TORONTO METRO MONTHS OF INVENTORY

- The most recent value of another market balance indicator, Sales-to-New Listings, was the weakest since at least 2006 for the month of April.
- It was 27% below the 10-year average, and historically, prices declined at a rate of 6% per year based on the current reading.
TORONTO METRO SALES-TO-NEW LISTINGS

Prices Continue To Increase
- All price metrics increased in April, with a typical property valued at $1,128,100
- Benchmark Price grew by 1.3% monthly, average price by 3.1% and median price by 0.4%.
- Prices slightly declined compared to the previous year and were 13-19% below the 2022 peak values.
TORONTO METRO REAL ESTATE PRICES
The Rental Market Is Stable
- Toronto Metro rental market strengthened in April, however only slightly after seasonal adjustment.
- The latest reading aligns with the 2013 – 2015 period when average rent prices grew by 0.6% annually.
- The rental market typically strengthens between December and August.
TORONTO METRO RENTAL MONTHS OF INVENTORY

The Average Rent Price Is Below Last Year's Level
- The average Toronto Metro rent price remained unchanged at $2,916 in April.
- It declined by 1.9% compared to the previous year.
- The average rent price typically increases between December and August.
TORONTO METRO AVERAGE RENT PRICE

New Construction Sales Continued To Be Low
- New construction sales in March were 68% below the 8-year average.
- Over the last twelve months, this number was 18,388, representing a 46% decrease from the historical average.
- Q1 2024 sales were the lowest since at least 2016.
TORONTO METRO NEW CONSTRUCTION SALES

New Construction Prices Increased Slightly
- The new high-rise benchmark price stood at $1,054,906 in March. It increased by 0.7% monthly, declined by 6% yearly and was 16% down from the peak.
- New low-rise benchmark price was $1,594,951. It increased by 0.7% monthly, declined by 11% yearly and was 18% below the peak value.
TORONTO METRO NEW CONSTRUCTION BENCHMARK PRICES

New Housing Construction Remained Strong
- Housing starts in March were 10% above the 10-year average.
- 49,473 units were started in Toronto Metro in the last twelve months, 26% above the historical average.
TORONTO METRO HOUSING STARTS

Housing Completions Were Robust
- Housing completions in March were 48% above the 10-year average.
- 44,801 units were completed in Toronto Metro in the last 12 months, 26% above the historical norm.
- This is slightly below the record level of 46,384 completions observed in 2015.
TORONTO METRO HOUSING COMPLETIONS

Mortgage Rates Were Steady
- The lowest 5-year fixed mortgage was unchanged at 4.79% in April.
- The lowest 5-year variable mortgage also remained unchanged at 5.95%.
LOWEST DISCOUNTED 5-YEAR MORTGAGE RATES IN CANADA

Housing Affordability Slightly Worsened
- An increase in house prices led to a slight deterioration in housing affordability in April.
- It requires 64% of typical household income to cover mortgage payments for a typical newly purchased property in the Toronto Metro, an increase from 63% observed previously.
TORONTO METRO HOUSING AFFORDABILITY

Unemployment Rate Continued To Grow
- The unemployment rate slightly increased in Toronto in March from 7.4% to 7.8%.
- It increased by 34% yearly and was 6% above the 10-year average.
TORONTO METRO UNEMPLOYMENT RATE

Mortgage Arrears Remained Unchanged
- Mortgage arrears in Ontario remained unchanged in February.
- They were up by 63% annually and 19% above the 10-year average.
MORTGAGE ARREARS IN ONTARIO

THE TAKEAWAY
In April 2024, the Toronto Metro real estate market experienced a notable weakening, characterized by a surge in new listings and a particularly significant increase in active inventory, which grew by 5,629 units (+45%) compared to the previous month. Such a substantial uptick is likely attributable to adjustments in the TRREB’s reporting methodology rather than indicative of an actual market shift. Nevertheless, the market continues to show signs of softening, and although prices are still on the rise, this trend is anticipated to reverse in the near future. The rental market, while weak, remains stable, with average rent prices declining below last year’s levels.
New construction sales remain sluggish, with first-quarter numbers for 2024 hitting their lowest point since at least 2016. However, housing construction was robust, with both starts and completions surpassing historical averages. The number of housing units completed in the last 12 months approached the record-high level of 46,384, observed in 2015.
Although mortgage rates remained unchanged in April, housing affordability slightly worsened due to rising house prices, necessitating 64% of household income to cover mortgage payments for a typical newly purchased property in the Toronto Metro area. Additionally, Toronto’s unemployment rate rose to 7.8% in March, reaching its highest level since 2014, excluding the pandemic period. Mortgage arrears remained stable in February.