Toronto’s housing market is poised for unprecedented turbulence, with record-high completions over the next few years set to collide with an impending supply drought.
This volatile landscape is marked by the weakest sales and rental markets since at least 2006, alongside soaring active inventory levels.
Surplus Shock


Key Developments
• Sales were the lowest since at least 2006 for May, excluding the pandemic.
• Resale active inventory continued to grow reaching the highest level since 2013.
• Both market balance indicators were the weakest since at least 2006 for May.
• The rental market was the weakest since at least 2012 for May.
• Average new construction sales remained below 50% for the past two years.
• The number of housing units completed in the last 12 months was the highest since at least 1972.
• Toronto’s unemployment rate increased to the highest level since 2014.
Looking Forward: Unveiling Opportunities
We have a supercharged supply pipeline for the next 2.5 years, and an empty supply pipeline after that.
While this will likely aid in price recovery in the future while we are realizing the supply gap,
it will also prove turbulent for the 3 years of elevated completions we’re seeing in 2024, 2025, and 2026
HISTORICAL CONDOMINIUM COMPLETIONS

Sales Activity Was Exceptionally Weak
In May, Toronto Metro experienced notably weak sales, with a slight decline compared to the previous month, both nominally and after seasonal adjustment. Despite remaining relatively unchanged from the previous month, sales were 22% below last year’s level and 27% below the 10-year average. With a figure of 7,013, it marked the weakest reading for this month since at least 2006, excluding the pandemic period. Traditionally, May represents a seasonal peak in sales, with activity declining towards the end of the year.
TORONTO METRO SALES

New Listings Activity Was Typical
The number of new listings in May was very typical for this time of year, increasing by 10% compared to the previous month and rising to 22% above last year’s level. May typically marks the peak of new listings, with activity tapering off towards the end of the year.
TORONTO METRO NEW LISTINGS

Active Inventory Reached The Highest Level Since 2013
Due to the low volume of sales and typical new listing activity in May, active inventory continued to increase both nominally and after seasonal adjustment. It grew by 20% monthly, and 83% yearly, reaching 21,760 listings – the highest level since 2013 and 34% above the 10-year average. Active inventory typically peaks in May and declines towards the end of the year.
TORONTO METRO ACTIVE LISTINGS

Toronto Became A Buyer's Market
The market balance indicator, Months of Inventory, weakened further in May, reaching its worst level for this month since at least 2006. It was 69% above the 10-year average, with historical data showing prices declining at a rate of 1% per year based on this reading. Condos remained weaker than the overall market across different segments. Looking ahead, seasonality will be working against the market, as it typically weakens between May and December.
TORONTO METRO MONTHS OF INVENTORY

The latest reading of another market balance indicator, Sales-to-New Listings, was also the weakest for May since at least 2006, mirroring the previous month. It was 30% below the 10-year average, with historical data indicating prices declining at a rate of 9% per year based on this reading.
TORONTO METRO SALES-TO-NEW LISTINGS

Prices Are Stable For Now
Price metrics in May presented a mixed picture: while average and median prices increased, the benchmark price declined to $1,117,400. Prices were down 3-4% compared to last year and 13-18% below peak values observed in 2022.
TORONTO METRO REAL ESTATE PRICES

The Rental Market Is The Weakest In The Last Decade
The Toronto Metro rental market weakened in May, both nominally and after seasonal adjustment, marking the weakest market balance figure for this month since at least 2012. A similar reading was observed in 2013, during which rent prices declined by 0.9%. May’s weakening was atypical, given that the market typically gains strength between December and August.
TORONTO METRO RENTAL MONTHS OF INVENTORY

The Average Rent Price Remains Below Last Year's Level
The average Toronto Metro rent price increased slightly in May to $2,953, remaining 2% below last year’s level. This rise aligns with seasonal trends, as rent prices typically see growth between December and August. Additionally, the gap between single-family and condo rents widened, remaining above the historical average.
TORONTO METRO AVERAGE RENT PRICE

New Construction Sales Remain Low
In April, new construction sales were 66% below the 8-year average. Over the last twelve months, sales totalled 17,102, marking a 50% decrease from the historical average. Additionally, these low sales levels have persisted for the last two years.
TORONTO METRO NEW CONSTRUCTION SALES

New Construction Prices Continued To Diverge
The new high-rise benchmark price stood at $1,056,786 in April, showing a monthly increase of 0.2%, a yearly decline of 4%, and a 16% decrease from the peak. Additionally, the new low-rise benchmark price was $1,617,896, with a monthly increase of 1.4%, a yearly decline of 9%, and a 16% decrease from the peak value.
TORONTO METRO NEW CONSTRUCTION BENCHMARK PRICES

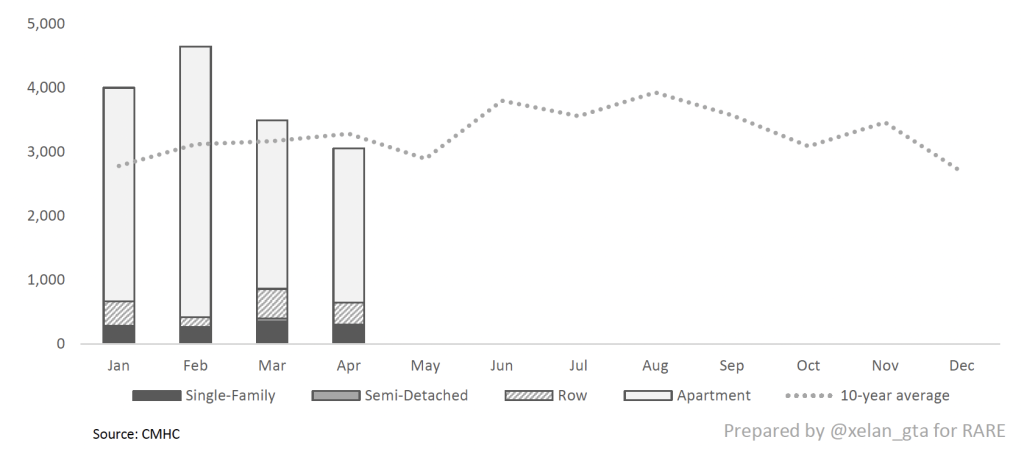
New Housing Starts Declined To Typical Level
Housing starts in April declined, dipping 7% below the 10-year average for the first time in 2024. This decline is likely related to the weak pre-construction sales observed over the previous years and is therefore expected to continue. In the last twelve months, 47,585 units were started in Toronto Metro, which is 21% above the historical average.
TORONTO METRO HOUSING STARTS
Housing Completions Were Record High
Housing completions in April were 113% above the 10-year average. In the last 12 months, 48,263 units were completed in Toronto Metro, marking a 36% increase from the historical norm. This also represents the highest number of completions recorded since at least 1972.
TORONTO METRO HOUSING COMPLETIONS

Mortgage Rates Were Steady
The lowest 5-year fixed mortgage rate remained unchanged at 4.79% in May, while the lowest 5-year variable mortgage rate also held steady at 5.95%.
LOWEST DISCOUNTED 5-YEAR MORTGAGE RATES IN CANADA

Housing Affordability Slightly Improved
A decline in the Toronto Metro benchmark price and an increase in household incomes resulted in a slight improvement in housing affordability in May. Now, it requires 63% of a typical household’s income to cover mortgage payments for a typical newly purchased property in Toronto Metro, a slight decrease from the previously observed 64%.
TORONTO METRO HOUSING AFFORDABILITY

Unemployment Rate Continued To Grow
The unemployment rate in Toronto Metro saw a slight increase in April, rising from 7.8% to 7.9%, and reaching its highest level since 2014 outside of the pandemic. This represents a 44% increase compared to the previous year and is 8% above the 10-year average.
TORONTO METRO UNEMPLOYMENT RATE

THE TAKEAWAY
In May, Toronto Metro experienced a decline in sales activity, reaching its weakest level since at least 2006, excluding the pandemic period. Despite this, new listings were typical for May and both of those factors combined led to an increase in active inventory, climbing to the highest level since 2013. Consequently, market balance indicators weakened further in May reaching the weakest level since at least 2006 for the current month. This indicates a buyer’s market, with historically declining prices, however, in May prices were relatively stable with some metrics posting declines while others exhibited growth. Due to weak market balance and seasonal factors, prices are expected to decline in the short term. The rental market also weakened, reaching its lowest level for May since at least 2012. The average rent price increased slightly but remained 2% below last year’s level.
In April, new construction sales remained low, averaging less than half of typical levels over the previous two years. Nevertheless, new construction prices saw a slight increase. The impact of low pre-construction sales is starting to affect housing starts, which declined in April to typical levels. Further declines are anticipated. On the other hand, housing completions are gaining momentum, with the number of units completed in the last 12 months being the highest since at least 1972.
Mortgage rates remained steady in May, while housing affordability saw a slight improvement due to a decline in the benchmark price and an increase in household incomes. However, affordability remains significantly higher than the historical average, with mortgage payments now requiring 63% of a typical household’s income. The unemployment rate in Toronto increased slightly in April to 7.9%, reaching its highest level since 2014 outside of the pandemic.